|
Pinna Resonances
Combining ear-shape measurement by MRI and acoustic-field visualization by FDTD simulation, the first three resonances of the human pinna were investigated across 19 adults (38 ears) and formulae were derived for estimating individual resonances from simple measurements. |
| BACKGROUND |
Humans can hear sounds in 3D thanks to a combination of binaural auditory cues caused by timing and level differences between the two ears, and monaural auditory cues imparted by the structural geometry of each outer-ear (pinna). All these cues are included in head-related transfer functions (HRTFs) which, although requiring special equipment and a great deal of patience to measure, capture the directional acoustic characteristics of each pinna. A person's HRTFs can then be used to deliver "virtual 3D audio" over sound reproduction equipment (headphones, earphones, or speaker systems) for that individual listener. However, as the shape and size (and therefore the acoustic characteristics) of each pinna are unique to each individual, spatially accurate and compelling 3D audio requires that HRTFs be personalized for each listener. In fact, it is the HRTF peaks and notches that are key to spatial hearing, and these are generated by the pinna's acoustic resonances. We therefore carried out a detailed study of the first three resonances in a number of adults, to better understand the typical patterns as well as individual differences, and to empirically derive mappings between the physiology and acoustics of human pinnae. This work has direct implications for the HRTF personalization that is necessary to create more effective and human-centric, 3D audio systems. 
|
| DEPTH RESONANCE |
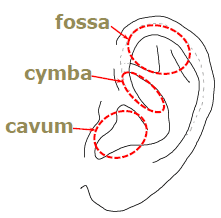
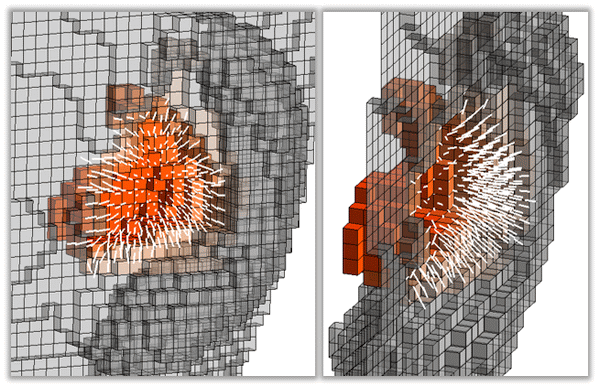
The first peak of HRTFs is known to be a depth resonance of the entire concha (including cavum and cymba). To examine this, magnetic resonance imaging (MRI) was used to measure the 3D shape of the head (including both pinnae) of 19 adults; and finite-difference time domain (FDTD) simulation was used to calculate HRTFs and extract the first peak (resonance), and then to compute and visualize the acoustic pressure and velocity fields in and around the pinna cavities, at each pinna's first resonance frequency. An example of a strong depth resonance is shown here in two views. 
Linear regression models were then evaluated in estimating the first resonance's center-frequency (F1) and amplitude (A1), from 25 different measurements of concha depth and aperture. As a result, F1 was best estimated (r=0.84, mean absolute error 118 Hz) by lateral distances from the base of the posterior cavum concha to the outer surface of the antitragus and antihelix; and A1 was best estimated (r=0.83, mean absolute error 0.84 dB) by the lateral distance from the ear-canal entrance to the side of the cheek near the anterior notch, and by an equivalent diameter of the concha aperture. For details, see Mokhtari et al. (2015) in the references below. |
| VERTICAL RESONANCES |
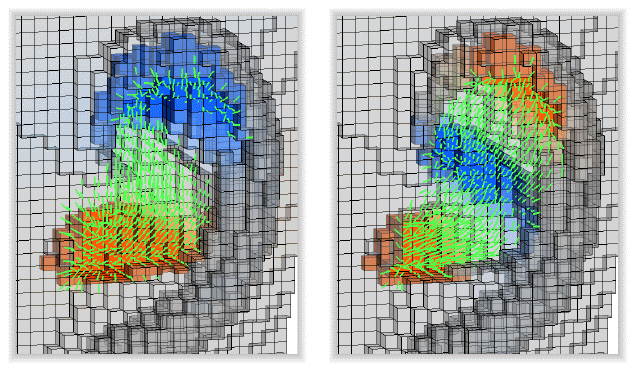
At frequencies above F1, human pinnae are known to have two normal modes with "vertical" resonance patterns, involving two or three pressure anti-nodes in cavum, cymba, and fossa. Our acoustic simulations revealed that while most of the 38 pinnae had both Cavum-Fossa and Cavum-Cymba normal modes, the degree of fossa involvement in both modes varied substantially across different pinnae, dependent on scaphoid fossa depth and cymba shallowness. Examples of the two modes with strong fossa involvement are shown here.
Linear regression models were evaluated in estimating the center-frequency of the two normal modes (Fcav-fos and Fcav-cym), from 3322 different measures derived from 31 anatomical landmarks. Fcav-fos was best estimated (r=0.89, mean absolute error 4.4%) by the distance from canal entrance to helix rim, and cymba horizontal depth. Fcav-cym was best estimated (r=0.92, mean absolute error 3.2%) by the sagittal-plane distance from concha floor to cymba anterior wall, and cavum horizontal depth. A number of interesting "atypical" resonance patterns were also found. For details, see Mokhtari et al. (2016) in the references below. |
| REFERENCES (chronological) |
P. Mokhtari, H. Takemoto, R. Nishimura & H. Kato (2015) Frequency and amplitude estimation of the first peak of head-related transfer functions from pinna anthropometry J. Acoust. Soc. Am., 137(2), 690-701. Copyright (2015) Acoustical Society of America. This article may be downloaded for personal use only. Any other use requires prior permission of the author and the Acoustical Society of America. This article appeared in (JASA 137, 690-701) and may be found at (http://dx.doi.org/10.1121/1.4906160). P. Mokhtari, H. Takemoto, R. Nishimura & H. Kato (2016) Vertical normal modes of human ears: individual variation and frequency estimation from pinna anthropometry J. Acoust. Soc. Am., 140(2), 814-831. Copyright (2016) Acoustical Society of America. This article may be downloaded for personal use only. Any other use requires prior permission of the author and the Acoustical Society of America. This article appeared in (JASA 140, 814-831) and may be found at (http://dx.doi.org/10.1121/1.4960481). |
| Copyright ©Parham Mokhtari 2000-2024 |
Updated: 06 November 2017 |
